
Page 55 - califmining1923
P. 55
STATISTICS OF ANNUAL PRODUCTION. 53
The following paragraph is quoted from the U. S. Geological Survey,
Advance Chapter on 1923, by courtesy of Mr. J. M. Hill, statistician in
charge of the San Francisco branch office :
"Of the total silver output of California in 1923 the 44 properties producing
over 1,000 ounces contributed 99.16 per cent. At 22 properties between 1,000 and
5,000 ounces were produced, at 11 mines between 5,000 and 10,000 ounces, at 7 mines
between 10,000 and 50,000 ounces, at 4 mines between 100,000 and 200,00 ounces, and
at only 1 property (California Rand Silver, Inc.) was more than 2,500,000 ounces
produced. Of the mines with an output of over 100,000 ounces 2 were lead mines in
Inyo County and 2 were copper mines in Plumas County. San Bernardino County
held first rank in silver production, followed by Inyo, Plumas, and Shasta counties.
The 10 largest silver producers in the state, named in order of rank, were California
Rand Silver, Inc. (Ag.), Engels Copper Co. (Cu.), Walker Mining Co. (Cu.), Darwin
Silver Co. (Pb.), Tecopa Consolidated Mg. Co. (Pb.), Zenda Mg. Co. (Ag.), Mammoth
Copper Co. (Cu.), Cerro Gordo Mines Co. (Pb), Empire Mines Co. (Au.), Mountain
Copper Co. (Cu.).
"The increase in the quantity of silver produced in California in 1923 was due
largely to the increased shipments from the Rand silver mines, in San Bernardino
County, and the lead ores produced in Inyo County, though the Zenda mine, in the
Amelia district, Kern County, made a considerable increase. Notable increases in
silver production were also made in Nevada, Orange, Shasta, and Trinity counties.
"The output of silver from placer mines in 1923 was 20,305 ounces, valued at
$16,650, an increase of 4 per cent in quantity and a decrease of 15 per cept in value,
as compared with 1922. Dredges saved 6 per cent more and surface mines 63 per
cent more silver than in 1922, but the drift arid hydraulic mines each made 31 per
cent less silver than in 1922.
"The production of silver from deep mines in 1923 was 3,539,138 ounces, valued
at $2,902,093, an increase of 15 per cent in quantity but a decrease of 6 per cent in
value, as compared with 1922. The Kelly mine, of the California Rand Silver, Inc., at
Randsburg, was by far the largest producer of silver in the state. Lead ores from
Inyo County gave the second largest output of silver, and copper ore from Plumas
County the third largest contribution to the total silver output in 1923. Dry gold
ores gave 2.31 per cent, silver ores 77.34 per cent, copper ores 9.59 per cent, and
lead ores 9.28 per cent of the total silver yield. The recovery of silver at gold and
silver mills in 1923 was 4 per cent, and smelters recovered 96 per cent of the total.
Concentrates carried 72 per cent, and ore sent direct to smelters 24 per cent of the
total silver produced at deep mines."
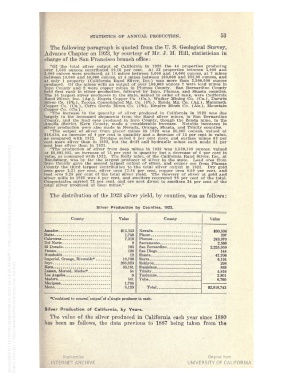
The distribution of the ,1923 silver yield, by counties, was as follows :
Silver Production 1 ay Counties, 1923.
Cotmty Value County Value
Amador $15,153 Nevada $30,534
Butte. 1,756 Placer 297
Calaveras 7,316 Plumas 243,970
Del Norte 9 Sacramento 2,566
El Dorado.. _ 185 2,225,959
Fresno 128 144
Humboldt 12 Shasta 47,706
Imperial, Orange, Riverside* 16,736 Sierra . 6,134
Inyo. 265,023 Siskiyou 298
Kern 33,151 833
Lassen, Merced, Modoc* 54 Trinity 5,816
Los Angeles . . 6 Tuolumne 2.801
Madera 541 Yuba 6,760
1,735
Mono 3.120 Total. $2,918,743
♦Combined to concearoutput'of a'single producer in each.
Silver Production of California, by Years.
The value of the silver produced in California each year since 1880
has been as follows, the data previous to 1887 being taken from the