
Page 16 - hb1831
P. 16
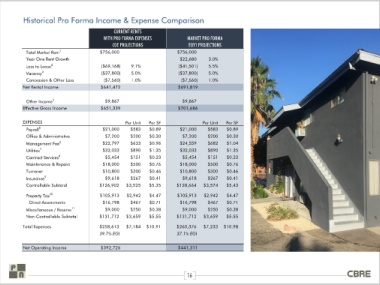
Historical Pro Forma Income & Expense Comparison


                                                                                         CURRENT RENTS
                                                                                    WITH PRO FORMA EXPENSES               MARKET PRO FORMA
                                                                                        COE PROJECTIONS                    EOY1 PROJECTIONS                                                                                                                          DECEMBER 2017 T12
                                                 Total Market Rent 1              $756,000                            $756,000
                                                 Year One Rent Growth                                                  $22,680      3.0%
                                                 Loss to Lease 2                   ($69,168)     9.1%                 ($41,501)     5.5%
                                                 Vacancy 3                         ($37,800)     5.0%                 ($37,800)     5.0%
                                                 Concession & Other Loss            ($7,560)     1.0%                  ($7,560)     1.0%
                                               Net Rental Income                   $641,472                           $691,819


                                                 Other Income 4                      $9,867                             $9,867
                                               Effective Gross Income              $651,339                           $701,686


                                               EXPENSES                                       Per Unit   Per SF                  Per Unit   Per SF
                                                 Payroll 5                          $21,000     $583     $0.89         $21,000      $583    $0.89
                                                 Office & Administrative             $7,200     $200     $0.30          $7,200      $200    $0.30
                                                 Management Fee 6                   $22,797     $633     $0.96         $24,559      $682    $1.04
                                                 Utilities 7                        $32,033     $890     $1.35         $32,033      $890    $1.35
                                                 Contract Services 8                 $5,454     $151     $0.23          $5,454      $151    $0.23
                                                 Maintenance & Repairs              $18,000     $500     $0.76         $18,000      $500    $0.76
                                                 Turnover                           $10,800     $300     $0.46         $10,800      $300    $0.46
                                                 Insurance 9                         $9,618     $267     $0.41          $9,618      $267    $0.41
                                                 Controllable Subtotal            $126,902    $3,525     $5.35       $128,664     $3,574    $5.43

                                                 Property Tax 10                  $105,913     $2,942    $4.47        $105,913    $2,942    $4.47
                                                  Direct Assessments                $16,798     $467     $0.71         $16,798      $467    $0.71
                                                 Miscellaneous / Reserve 11          $9,000     $250     $0.38          $9,000      $250    $0.38
                                                 Non-Controllable Subtotal        $131,712    $3,659     $5.55       $131,712     $3,659    $5.55

                                               Total Expenses                     $258,613    $7,184    $10.91       $260,376     $7,233   $10.98
                                                                                  39.7% EGI                          37.1% EGI


                                               Net Operating Income                $392,726                           $441,311


                                                                                                                          16