
Page 4 - kessel1950
P. 4
320 CALIFORNIA MEDICINE Vol. 73, No. 4
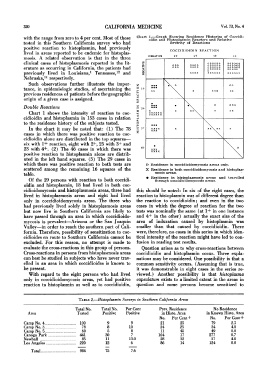
with the range from zero to 4 per cent. Most of those Chart l.-Graph Showing Residence Histories of Coccidi-
oidin and Histoplasmin Reactors and Relative
tested in this Southern California survey who had Severity of Reactions
positive reaction to histoplasmin, had previously COCCIDIOIDIN REACTION
lived in areas reported to be endemic for histoplas- 2+ 4+
mosis. A related observation is that in the three NEGATIVE 1+ 3+
clinical cases of histoplasmosis reported in the lit- 000000 000000
000 0000 000000 000000
erature as occurring in California, the patients had 000 0000 000000 000000
000000
00000
previously lived in Louisiana,4 Tennessee,12 and z xxxx xxxxxx xxxxxx
Nebraska,14 respectively.
Such observations further illustrate the impor- z
tance, in epidemiologic studies, of ascertaining the o 1+
0I-
previous residences of patients before the'geographic J ::: 00 \ 0 00o
00
@0
* 0
origin of a given case is assigned. w
Double Reactions -2+
x x xx\ x xx
Chart 1 shows the intensity of reaction to coc-
cidioidin and histoplasmin in 153 cases in relation
0.
to the residence history of the subjects tested. 0
In the chart it may be noted that: (1) The 78 3+ xxxx x xx\ xx x
xxx
xxxxx \
cases in which there was positive reaction to coc-
cidioidin alone are distributed in the top squares-
six with 1+ reaction, eight with 2+, 25 with 3+ and
4+
23 with 4+. (2) The 46 cases in which there was
positive reaction to histoplasmin alone are distrib-
uted in the left hand squares. (3) The 29 cases in
which there was positive reaction to both tests are O Residence in coccidioldomycosis areas only.
scattered among the remaining 16 squares of the X Residence in both coccidioidomycosis and histoplas-
table. mosis areas.
* Residence in histoplasmosis areas and travelled
Of the 29 persons with reaction to both coccidi- through coccidioidomycosis areas.
oidin and histoplasmin, 18 had lived in both coc-
cidioidomycosis and histoplasmosis areas, three had this should be noted: In six of the eight cases, the
lived in histoplasmosis areas and eight had lived reaction to histoplasmin was of different degree than
only in coccidioidomycosis areas. The three who the reaction to coccidioidin; and even in the two
had previously lived solely in histoplasmosis areas cases in which the degree of reaction for the two
but now live in Southern California are likely to tests was nominally the same (at 1+ in one instance
have passed through an area in which coccidioido- and 4+ in the other) actually the exact size of the
mycosis is prevalent-Arizona or the San Joaquin area of induration caused by histoplasmin was
Valley-in order to reach the southern part of Cali- smaller than that caused by coccidioidin. There
fornia. Therefore, possibility of sensitization to coc- were, therefore, no cases in this series in which iden-
cidioides en route to Southern California cannot be tical intensity of the reaction might have led to con-
excluded. For this reason, no attempt is made to fusion in reading test results.
evaluate the cross-reactions in this group of persons. Question arises as to why cross-reactions between
Cross-reactions in persons from histoplasmosis areas coccidioidin and histoplasmin occur. Three expla-
can best be studied in subjects who have never trav- nations may be considered. One possibility is that a
elled in an area in which coccidioides is known to common sensitivity occurs. (Assuming that is true,
be present. it was demonstrable in eight cases in the series re-
With regard to the eight persons who had lived viewed.) Another possibility is that histoplasma
only in coccidioidomycosis areas, yet had positive capsulatum exists to a limited extent in the areas in
reaction to histoplasmin as well as to coccidioidin, question and some persons become sensitized to
TABLE 2.-Histoplasmin Surveys in Southern California Areas
Total No. Total No. Per Cent Prev. Residence No Residence
Area Tested Positive Positive in Histo. Area in Known Histo. Area
No. Per Cent+ No. Per Cent +
Camp No. 4. 100 9 9 21 25 79 2.5
Camp No. 3 78 8 10 24 25 54 4.0
Camp No. 5 .- . 60 5 8 11 45 49 0.0
Canoga Park 441 30 7 164 17 277 0.7
Newhall 85 11 13.0 28 32 57 4.0
Los Angeles 220 12 6 86 14 124 0.0
Total . 984 75 7.6