
Page 5 - laedc_scrra_score_20191031
P. 5
SCORE Economic Impact Analysis
figures are averages derived from estimated impacts
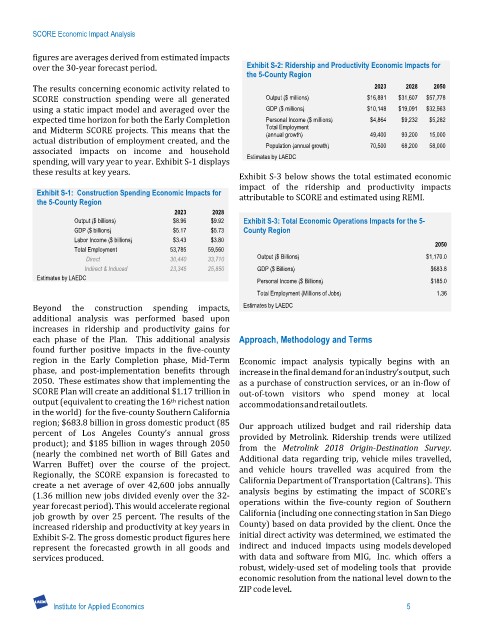
over the 30-year forecast period. Exhibit S-2: Ridership and Productivity Economic Impacts for
the 5-County Region
The results concerning economic activity related to 2023 2028 2050
SCORE construction spending were all generated Output ($ millions) $16,891 $31,607 $57,778
using a static impact model and averaged over the GDP ($ millions) $10,148 $19,091 $32,563
expected time horizon for both the Early Completion Personal Income ($ millions) $4,864 $9,232 $5,282
and Midterm SCORE projects. This means that the Total Employment 49,400 93,200 15,000
(annual growth)
actual distribution of employment created, and the
associated impacts on income and household Population (annual growth) 70,500 68,200 58,000
spending, will vary year to year. Exhibit S-1 displays Estimates by LAEDC
these results at key years. Exhibit S-3 below shows the total estimated economic
impact of the ridership and productivity impacts
Exhibit S-1: Construction Spending Economic Impacts for
the 5-County Region attributable to SCORE and estimated using REMI.
2023 2028
Output ($ billions) $8.96 $9.92 Exhibit S-3: Total Economic Operations Impacts for the 5-
GDP ($ billions) $5.17 $5.73 County Region
Labor Income ($ billions) $3.43 $3.80
Total Employment 53,785 59,560 2050
Direct 30,440 33,710 Output ($ Billions) $1,170.0
Indirect & Induced 23,345 25,850 GDP ($ Billions) $683.8
Estimates by LAEDC Personal Income ($ Billions) $185.0
Total Employment (Millions of Jobs) 1.36
Beyond the construction spending impacts, Estimates by LAEDC
additional analysis was performed based upon
increases in ridership and productivity gains for
each phase of the Plan. This additional analysis Approach, Methodology and Terms
found further positive impacts in the five-county
region in the Early Completion phase, Mid-Term Economic impact analysis typically begins with an
phase, and post-implementation benefits through increase in the final demand for an industry’s output, such
2050. These estimates show that implementing the as a purchase of construction services, or an in-flow of
SCORE Plan will create an additional $1.17 trillion in out-of-town visitors who spend money at local
output (equivalent to creating the 16 richest nation accommodations and retail outlets.
th
in the world) for the five-county Southern California
region; $683.8 billion in gross domestic product (85 Our approach utilized budget and rail ridership data
percent of Los Angeles County’s annual gross provided by Metrolink. Ridership trends were utilized
product); and $185 billion in wages through 2050 from the Metrolink 2018 Origin-Destination Survey.
(nearly the combined net worth of Bill Gates and Additional data regarding trip, vehicle miles travelled,
Warren Buffet) over the course of the project.
Regionally, the SCORE expansion is forecasted to and vehicle hours travelled was acquired from the
create a net average of over 42,600 jobs annually California Department of Transportation (Caltrans). This
(1.36 million new jobs divided evenly over the 32- analysis begins by estimating the impact of SCORE’s
year forecast period). This would accelerate regional operations within the five-county region of Southern
job growth by over 25 percent. The results of the California (including one connecting station in San Diego
increased ridership and productivity at key years in County) based on data provided by the client. Once the
Exhibit S-2. The gross domestic product figures here initial direct activity was determined, we estimated the
represent the forecasted growth in all goods and indirect and induced impacts using models developed
services produced. with data and software from MIG, Inc. which offers a
robust, widely-used set of modeling tools that provide
economic resolution from the national level down to the
ZIP code level.
Institute for Applied Economics 5