
Page 636 - northlakehills_deir_0517
P. 636
NorthLake Specific Plan
Draft Supplemental EIR
It should be noted that the vibration level that causes a potential for structural damage from
blasting is not the same as the structural damage potential data shown in Table 5.10-10. Data
from blasting research shows that no residential damage is likely to occur at blast vibration levels
less than 2.0 ppv in/sec (Caltrans 2013b).
U.S. Bureau of Mines
The U. S Bureau of Mines (USBM) 1980 publication, “Structure Response and Damage Produced
by Ground Vibration From Surface Mine Blasting” includes the following conclusions (Caltrans
2013b):
• The potential for damage to residential structures is greater with low-frequency blast
vibration (below 40 Hz) than with high frequency blast vibration (40 Hz and above).
• The type of residential construction is a factor in the vibration amplitude required to cause
damage
• For low-frequency blast vibration, a limit of 0.75 in/sec ppv for modern drywall construction
and 0.50 in/sec ppv for older plaster-on-lath construction was proposed. For frequencies
above 40 Hz, a limit of 2.0 in/sec ppv for all types of construction was proposed
Caltrans Guidance
Human response to blast vibration and air overpressures from blasting is difficult to quantify.
Ground vibration and air overpressures can be felt at levels that are well below those required to
produce any damage to structures. The duration of the event has an effect on human response,
as does the frequency. Events are of short duration, 1–2 seconds, for millisecond-delayed blasts.
Typically, the longer the event and the higher the frequency, the more adverse the effect on
human response. Factors such as frequency of occurrence, fright or “startle factor,” level of
personal activity at the time of the event, health of the individual, time of day, orientation of the
individual (standing up or lying down), the perceived importance of the blasting operation, and
other political and economic considerations also affect human response (Caltrans 2013b).
Although the duration of an event affects human response, some researchers have found that
fewer blasts of a longer duration are preferable to many blasts with shorter durations. There would
be fewer times of perceived disturbance. Fixed locations such as quarries may be able to take
advantage of this. Construction projects, however, usually have constraints such as smaller
volumes of material to be blasted and sequence of the work that would preclude this.
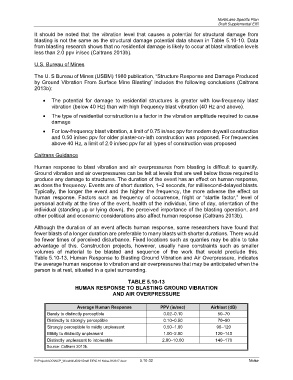
Table 5.10-13, Human Response to Blasting Ground Vibration and Air Overpressure, indicates
the average human response to vibration and air overpressures that may be anticipated when the
person is at rest, situated in a quiet surrounding.
TABLE 5.10-13
HUMAN RESPONSE TO BLASTING GROUND VIBRATION
AND AIR OVERPRESSURE
Average Human Response PPV (in/sec) Airblast (dB)
Barely to distinctly perceptible 0.02–0.10 50–70
Distinctly to strongly perceptible 0.10–0.50 70–90
Strongly perceptible to mildly unpleasant 0.50–1.00 90–120
Mildly to distinctly unpleasant 1.00–2.00 120–140
Distinctly unpleasant to intolerable 2.00–10.00 140–170
Source: Caltrans 2013b.
R:\Projects\OC\WCP_Woodrid\J0001\Draft EIR\5.10 Noise-042617.docx 5.10-32 Noise