
Page 742 - sandcanyonplaza_deir0317
P. 742
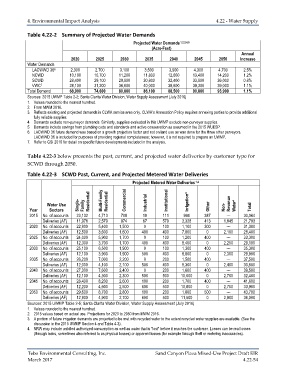
4. Environmental Impact Analysis                                              4.22 - Water Supply


             Table 4.22-2  Summary of Projected Water Demands
                                                         Projected Water Demands  1,2,3,4,5
                                                                (Acre-Feet)
                                                                                                      Annual
                               2020      2025      2030       2035      2040      2045       2050    Increase
             Water Demands
              LACWWD 36        2,300     2,700     3,100     3,500      3,900     4,300     4,700      2.5%
                        6
              NCWD            10,100    10,700     11,200    11,800    12,600     13,400    14,200     1.2%
              SCWD            28,400    29,100     29,900    30,800    32,400     33,900    36,000     0.8%
              VWC             28,100    31,200     36,600    40,000    39,600     39,300    39,000     1.1%
                  7
             Total Demand     68,900    74,600     80,800    86,100    88,500     90,800    93,900     1.1%
             Sources: 2015 UWMP Table 2-2; Santa Clarita Water Division, Water Supply Assessment (July 2016)
             1.  Values rounded to the nearest hundred.
             2.  From MWM 2016.
             3.   Reflects existing and projected demands in CLWA service area only. CLWA’s Annexation Policy requires annexing parties to provide additional
               fully reliable supplies.
             4.   Demands exclude non-purveyor demands. Similarly, supplies evaluated in this UWMP exclude non-purveyor supplies.
             5.   Demands include savings from plumbing code and standards and active conservation as assumed in the 2015 WUESP.
             6.   LACWWD 36 future demand was based on a growth projection factor and not on land use as was done for the three other purveyors.
               LACWWD 36 is included for purposes of providing regional completeness; however, it is not required to prepare an UWMP.
             7.   Refer to GSI 2016 for detail on specific future developments included in the analysis.

             Table 4.22-3 below presents the past, current, and projected water deliveries by customer type for
             SCWD through 2050.
             Table 4.22-3  SCWD Past, Current, and Projected Metered Water Deliveries

                                                        Projected Metered Water Deliveries
                                                                                    1,2


                     Water Use    Single-  Family   Residential   Multi-Family   Residential   Commercial   Industrial   Institutional   Irrigation 3    Other   Revenue   Water 4    Total
             Year     Sectors                                                                  Non-
             2015  No. of accounts   23,132   4,713   708    19      111      994     387       ---    30,064
                   Deliveries (AF)   11,978   2,579   974    87      579     3,328    413      1,845   21,783
             2020  No. of accounts   22,900   5,400   1,500   0      100     1,100    300       ---    31,300
                   Deliveries (AF)   12,500   3,600   1,600   400    400     7,800     0       2,100   28,400
             2025  No. of accounts   24,000   5,900   1,700   0      100     1,200    400       ---    33,300
                   Deliveries (AF)   12,300   3,700   1,700   400    400     8,400     0       2,200   29,100
             2030  No. of accounts   25,100   6,500   1,900   0      100     1,300    400       ---    35,300
                   Deliveries (AF)   12,100   3,900   1,900   500    400     8,800     0       2,300   29,900
             2035  No. of accounts   26,200   7,000   2,200   0      200     1,500    400       ---    37,500
                   Deliveries (AF)   12,000   4,100   2,100   500    400     9,300     0       2,400   30,800
             2040  No. of accounts   27,300   7,600   2,400   0      200     1,600    400       ---    39,500
                   Deliveries (AF)   12,100   4,300   2,300   500    500     10,000    0       2,700   32,400
             2045  No. of accounts   28,400   8,200   2,600   100    200     1,700    400       ---    41,600
                   Deliveries (AF)   12,200   4,600   2,500   600    500     10,800    0       2,700   33,900
             2050  No. of accounts   29,600   8,700   2,800   100    200     1,800    500       ---    43,700
                   Deliveries (AF)   12,900   4,900   2,700   600    500     11,500    0       2,900   36,000
             Sources: 2015 UWMP Table 2-5; Santa Clarita Water Division, Water Supply Assessment (July 2016)
             1.  Values rounded to the nearest hundred.
             2.  2015 values based on actual use. Projections for 2020 to 2050 from MWM 2016.
             3.  A portion of future irrigation demands are projected to be met with recycled water to the extent recycled water supplies are available. (See the
               discussion in the 2015 UWMP Section 4 and Table 4-3).
             4.  NRW may include unbilled authorized consumption as well as water that is "lost" before it reaches the customer. Losses can be real losses
               (through leaks, sometimes also referred to as physical losses) or apparent losses (for example through theft or metering inaccuracies).


             Tebo Environmental Consulting, Inc.                  Sand Canyon Plaza Mixed-Use Project Draft EIR
             March 2017                                                                                4.22-54