
Page 622 - skylineranchdeir0709
P. 622
4.I Water Resources
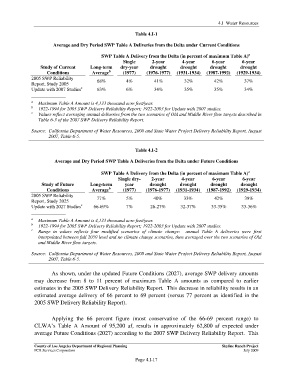
Table 4.I-1
Average and Dry Period SWP Table A Deliveries from the Delta under Current Conditions
a
SWP Table A Delivery from the Delta (in percent of maximum Table A)
Single 2-year 4-year 6-year 6-year
Study of Current Long-term dry-year drought drought drought drought
b
Conditions Average (1977) (1976-1977) (1931-1934) (1987-1992) (1929-1934)
2005 SWP Reliability 68% 4% 41% 32% 42% 37%
Report, Study 2005
Update with 2007 Studies c 63% 6% 34% 35% 35% 34%
a Maximum Table A Amount is 4,133 thousand acre feet/year.
b
1922-1994 for 2005 SWP Delivery Reliability Report; 1922-2003 for Update with 2007 studies.
c Values reflect averaging annual deliveries from the two scenarios of Old and Middle River flow targets described in
Table 6-3 of the 2007 SWP Delivery Reliability Report.
Source: California Department of Water Resources, 2008 and State Water Project Delivery Reliability Report, August
2007, Table 6-5.
Table 4.I-2
Average and Dry Period SWP Table A Deliveries from the Delta under Future Conditions
a
SWP Table A Delivery from the Delta (in percent of maximum Table A)
Single dry- 2-year 4-year 6-year 6-year
Study of Future Long-term year drought drought drought drought
b
Conditions Average (1977) (1976-1977) (1931-1934) (1987-1992) (1929-1934)
2005 SWP Reliability
Report, Study 2025 77% 5% 40% 33% 42% 38%
Update with 2027 Studies c 66-69% 7% 26-27% 32-37% 33-35% 33-36%
a
Maximum Table A Amount is 4,133 thousand acre feet/year.
b 1922-1994 for 2005 SWP Delivery Reliability Report; 1922-2003 for Update with 2007 studies.
c
Range in values reflects four modified scenarios of climate change: annual Table A deliveries were first
interpolated between full 2050 level and no climate change scenarios, then averaged over the two scenarios of Old
and Middle River flow targets.
Source: California Department of Water Resources, 2008 and State Water Project Delivery Reliability Report, August
2007, Table 6-5.
As shown, under the updated Future Conditions (2027), average SWP delivery amounts
may decrease from 8 to 11 percent of maximum Table A amounts as compared to earlier
estimates in the 2005 SWP Delivery Reliability Report. This decrease in reliability results in an
estimated average delivery of 66 percent to 69 percent (versus 77 percent as identified in the
2005 SWP Delivery Reliability Report).
Applying the 66 percent figure (most conservative of the 66-69 percent range) to
CLWA’s Table A Amount of 95,200 af, results in approximately 62,800 af expected under
average Future Conditions (2027) according to the 2007 SWP Delivery Reliability Report. This
County of Los Angeles Department of Regional Planning Skyline Ranch Project
PCR Services Corporation July 2009
Page 4.I-17
PRELIMINARY WORKING DRAFT – Work in Progress