
Page 822 - tesoro_sdeir0218
P. 822
Tesoro del Valle (Phases A, B, C)
Draft Supplemental EIR
Threshold 5.19-3: Would the Project have sufficient reliable water supplies available to serve
the Project demands from existing entitlements and resources, considering
existing and projected water demands from other land uses?
Level of Significance without Mitigation: Less Than Significant
Recommended 1999 FEIR Mitigation Measures: None
Level of Significance with 1999 FEIR Mitigation: Less Than Significant
Recommended Project Specific Mitigation Measures:
MM Util-3 Throughout the duration of all construction activities requiring pumping from local
groundwater wells, the Project applicant or property owner shall ensure that an
adequate volume and quality of water remains available to all individuals who
normally access the wells.
Net Level of Significance: Less Than Significant
Comparison to 1999 FEIR: The Project impacts would be consistent with the findings identified
in Section 5.10, Public Services and Utilities, of the 1999 FEIR.
The Project would result in an increase in water demand and would affect existing water supplies.
A Project-specific Water Supply Assessment was prepared to further evaluate the adequacy of
CLWA’s water supplies to meet the anticipated demands of the Project.
Projected Water Demand
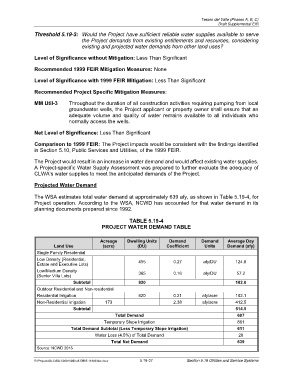
The WSA estimates total water demand at approximately 639 afy, as shown in Table 5.19-4, for
Project operation. According to the WSA, NCWD has accounted for that water demand in its
planning documents prepared since 1992.
TABLE 5.19-4
PROJECT WATER DEMAND TABLE
Acreage Dwelling Units Demand Demand Average Day
Land Use (acre) (DU) Coefficient Units Demand (afy)
Single Family Residential
Low Density (Residential, 455 0.27 afy/DU 124.8
Estate and Executive Lots)
Low/Medium Density
(Senior Villa Lots) 365 0.16 afy/DU 57.2
Subtotal 820 182.0
Outdoor Residential and Non-residential
Residential Irrigation 820 0.21 afy/acre 102.1
Non-Residential Irrigation 173 2.38 afy/acre 412.5
Subtotal 514.5
Total Demand 697
Temporary Slope Irrigation 861
Total Demand Subtotal (Less Temporary Slope Irrigation) 611
Water Loss (4.5%) of Total Demand 28
Total Net Demand 639
Source: NCWD 2016
R:\Projects\BLC\3BLC000100\Draft EIR\5.19 Utilities.docx 5.19-27 Section 5.19 Utilities and Service Systems