
Page 1804 - trc_centennial_deir201705
P. 1804
5.18 Water Resources
year (Table 5.18-3) and by approximately 41,200 afy during a multiple-dry year drought
(Table 5.18-4).
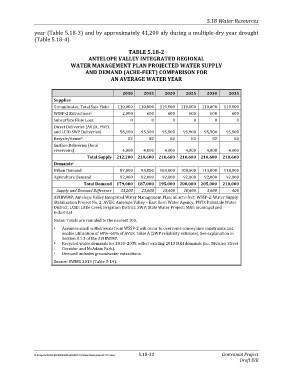
TABLE 5.18-2
ANTELOPE VALLEY INTEGRATED REGIONAL
WATER MANAGEMENT PLAN PROJECTED WATER SUPPLY
AND DEMAND (ACRE-FEET) COMPARISON FOR
AN AVERAGE WATER YEAR
2010 2015 2020 2025 2030 2035
Supplies
Groundwater, Total Safe Yield 110,000 110,000 110,000 110,000 110,000 110,000
WSSP-2 Extractions a 2,000 600 600 600 600 600
Subsurface Flow Loss 0 0 0 0 0 0
Direct Deliveries (AVEK, PWD,
and LCID SWP Deliveries) 96,100 95,900 95,900 95,900 95,900 95,900
Recycle/Reuse b 82 82 82 82 82 82
Surface Deliveries (local
reservoirs) 4,000 4,000 4,000 4,000 4,000 4,000
Total Supply 212,200 210,600 210,600 210,600 210,600 210,600
Demands c
Urban Demand 87,000 95,000 103,000 108,000 113,000 118,000
Agriculture Demand 92,000 92,000 92,000 92,000 92,000 92,000
Total Demand 179,000 187,000 195,000 200,000 205,000 210,000
Supply and Demand Difference 33,200 23,600 15,600 10,600 5,600 600
AVIRWMP: Antelope Valley Integrated Water Management Plan; af: acre-feet; WSSP-2: Water Supply
Stabilization Project No. 2; AVEK: Antelope Valley – East Kern Water Agency; PWD: Palmdale Water
District; LCID: Little Creek Irrigation District; SWP: State Water Project; M&I: municipal and
industrial
Notes: Totals are rounded to the nearest 100.
a Assumes small withdrawals from WSSP-2 will occur to overcome conveyance constraints and
enable utilization of 60%–61% of AVEK Table A (SWP reliability estimate). See explanation in
Section 3.1.2 of the AVIRWMP.
b Recycled water demands for 2010–2035 reflect existing 2013 M&I demands (i.e., Division Street
Corridor and McAdam Park).
c Demand includes groundwater extractions.
Source: RWMG 2013 (Table 3-14).
R:\Projects\PAS\CEN\000306\Draft EIR\5.18 Water Resources-051117.docx 5.18-32 Centennial Project
Draft EIR