
Page 565 - trc_centennial_deir201705
P. 565
5.4 Water Quality
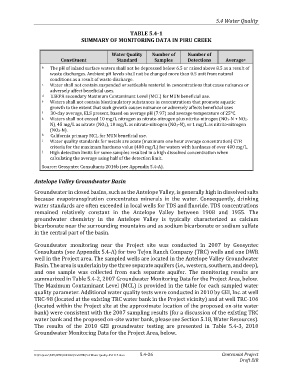
TABLE 5.4-1
SUMMARY OF MONITORING DATA IN PIRU CREEK
Water Quality Number of Number of
Constituent Standard Samples Detections Average
a
b The pH of inland surface waters shall not be depressed below 6.5 or raised above 8.5 as a result of
waste discharges. Ambient pH levels shall not be changed more than 0.5 unit from natural
conditions as a result of waste discharge.
c Water shall not contain suspended or settleable material in concentrations that cause nuisance or
adversely affect beneficial uses.
d USEPA secondary Maximum Contaminant Level (MCL) for MUN beneficial use.
e Waters shall not contain biostimulatory substances in concentrations that promote aquatic
growth to the extent that such growth causes nuisance or adversely affects beneficial uses
f 30-day average, ELS present, based on average pH (7.97) and average temperature of 25°C.
g Waters shall not exceed 10 mg/L nitrogen as nitrate-nitrogen plus nitrite-nitrogen (NO3-N + NO2-
N), 45 mg/L as nitrate (NO3), 10 mg/L as nitrate-nitrogen (NO3-N), or 1 mg/L as nitrite-nitrogen
(NO2-N).
h California primary MCL for MUN beneficial use.
i Water quality standards for metals are acute (maximum one hour average concentration) CTR
criteria for the maximum hardness value (400 mg/L) for waters with hardness of over 400 mg/L.
j High detection limits for some samples resulted in a high dissolved concentration when
calculating the average using half of the detection limit.
Source: Geosyntec Consultants 2016b (see Appendix 5.4-A).
Antelope Valley Groundwater Basin
Groundwater in closed basins, such as the Antelope Valley, is generally high in dissolved salts
because evapotranspiration concentrates minerals in the water. Consequently, drinking
water standards are often exceeded in local wells for TDS and fluoride. TDS concentrations
remained relatively constant in the Antelope Valley between 1908 and 1955. The
groundwater chemistry in the Antelope Valley is typically characterized as calcium
bicarbonate near the surrounding mountains and as sodium bicarbonate or sodium sulfate
in the central part of the basin.
Groundwater monitoring near the Project site was conducted in 2007 by Geosyntec
Consultants (see Appendix 5.4-A) for two Tejon Ranch Company (TRC) wells and one DWR
well in the Project area. The sampled wells are located in the Antelope Valley Groundwater
Basin. The area is underlain by the three separate aquifers (i.e., western, southern, and deep),
and one sample was collected from each separate aquifer. The monitoring results are
summarized in Table 5.4-2, 2007 Groundwater Monitoring Data for the Project Area, below.
The Maximum Contaminant Level (MCL) is provided in the table for each sampled water
quality parameter. Additional water quality tests were conducted in 2010 by GEI, Inc. at well
TRC-98 (located at the existing TRC water bank in the Project vicinity) and at well TRC-106
(located within the Project site at the approximate location of the proposed on-site water
bank) were consistent with the 2007 sampling results (for a discussion of the existing TRC
water bank and the proposed on-site water bank, please see Section 5.18, Water Resources).
The results of the 2010 GEI groundwater testing are presented in Table 5.4-3, 2010
Groundwater Monitoring Data for the Project Area, below.
R:\Projects\PAS\CEN\000306\Draft EIR\5.4 Water Quality-051117.docx 5.4-26 Centennial Project
Draft EIR