
Page 80 - califmining1923
P. 80
78 MINERAL INDUSTRY OF CALIFORNIA.
Estimates have been made for some of this output, based on the mileage
of roads repaired.
For the year 1923 miscellaneous stone shows an increase both in
total tonnage and value over the preceding year, being $15,395,652 as
compared with $10,377,783 in 1922. Sand and gravel showed a slight
decrease in average unit values reported, but crushed rock prices
remained practically the same. The crushed rock tonnage increased
from a total of 5,737,337 in 1922 to 8,519,611 in 1923, with sand and
gravel advancing from 7,312,307 tons to 11,320,690 tons. Continuance
of general building work and highway paving are responsible.
The largest increase was shown by Los Angeles County, which for
some years past has led all others by a wide margin, with an output
valued at $5,408,808 (compared with $3,390,477 in 1922) ; followed by
Alameda, second, with $965,465; Fresno, third, $863,087; Riverside,
fourth, $714,899; Sacramento, fifth, $649,939; Contra Costa, sixth,
$629,216; Orange, seventh, $536,767; Marin, eighth, $516,936; followed
in turn by San Benito, Humboldt, San Bernardino, San Diego, Butte,
Santa Clara, and San Joaquin, in the order named, each with a total
value in excess of a quarter-million dollars.
Paving Blocks.
The paving block industry has decreased materially of recent years,
almost to the vanishing point, because of the increased construction of
smoother pavements demanded by motor- vehicle traffic. The blocks
made in Solano County were of basalt; those from Sonoma are of
basalt, andesite, and some trachyte, while those from Placer, Riverside,
San Bernardino, and San Diego are of granite.
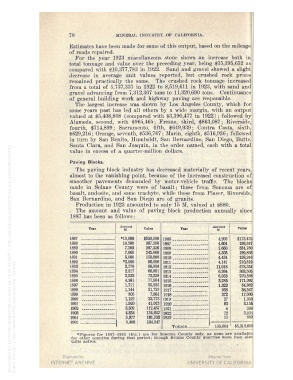
Production in 1923 amounted to only 15 M, valued at $880.
The amount and value of paving block production annually since
1887 has been as follows :
Amount Amount
Tear M Value Tear M Value
1887 ♦10,000 $350,000 1906 4,203 $173,432
1888 10,500 367.500 1907 4,604 199,347
1889 ..._. 7.303 297.236 1908 7,660 334,780
1890 _.„. 7,000 245.000 1909 4,503 199,803
1891 .__ 5.000 150.000 1910 4,434 198,916
1892 *3,000 96.000 1911 4,141 210.819
1893 2,770 96.950 1912 11,018 578,355
1894 2,517 66.981 1913 6,364 363,505
1895 2,332 73,338 1914 6.053 270,598
1896 4.161 77.584 1915 3,285 171,092
1897 1,711 35.235 1916 1,322 54,362
1898 1,144 21.725 1917 938 38,567
1899 305 7.861 1918 372 17,000
1900 1.192 23.775 1919 _. 27 1.350
1901 1,920 41.075 1920 63 3,155
1902 3,502 112,437 1921 _ 4 280
1903 4,854 134.642 1922 — — 72 3,924
1904 „ - 8.977 161,752 1923 15 880
1905 —V 3.408 134,347 ^
Totals 135,664 $5,313,603
♦Figures for 1887-1892 (inc.) are for Sonoma County only, as none are available
for other counties during that period ; though Solano County quarries were then also
quite active.