|
|
|
The California Winter of 1997-98.
By Kelly Redmond, Regional Climatologist Western Regional Climate Center | Reno, Nevada Status Report for Federal Emergency Management Agency March 3, 1998.
The winter of 1997-98 has become the latest in a succession of memorable winters for the state of California extending over the past 15 years. This period began with the snowiest and wettest winter on record in 1982-83 for much of the state. After the February 1986 flood, the state entered an extended period of six consecutive dry winters from 1986-87 through 1991-92, ending with the very wet 1992-93, one more dry winter in 1993-94, and then four consecutive wet winters from 1994-95 through 1997-98. The previous winter of 1996-97 featured one of California's largest and costliest floods ever, in early January, followed by a record dry period into summer. A four-year stretch of wet winters has not occurred for a half-century or more. Overall, this has been a period of highly variable climate for the state of California. In March of 1997 another El Nino developed (by most counts, the 9th El Nino year since 1976, an item of great interest globally), then grew rapidly. From late summer through approximately January 1998 this event exceeded (by most criteria) the previous record El Nino of 1982-83. After January 1998, the 1982-83 El Nino, which peaked later in the winter, was the "stronger" of the two. Historical studies show that El Nino usually (not always) brings wetter winters to central and especially southern California. Large El Ninos (a very limited sample) appear to extend wet conditions further north. A second forecasting tool, namely the recently improved physically based numerical simulations of seasonal climate, being put to their first important test, indicated a similar outcome. Much of what the winter could bring was understood, and widely publicized, by early autumn, well before the rainy season, when there was little to do but talk, and wait. This situation, of predicted potential major impacts of a natural event months in advance of their actual occurrence, and an almost palpable region-side sense of apprehension and expectation, is unprecedented in the history of the United States. The 1997 portion of the winter was relatively uneventful, although November was somewhat wetter than usual in the northern Sierra. One very powerful and significant storm affected southern California around December 6th, bringing 8-11" in one day to the mountains north of Los Angeles. This storm later affected desert regions to the east. As occurs more often during El Nino conditions, storms tended to split and direct their energy and effects southward and northward along the coast. The Sierra snowpack accumulated more slowly than average in December, then sped up and only reached to near average by the end of January. Along the coast, precipitation accumulated steadily, and the northern California 8-station index (representing the upper Sacramento River, an important water supply region) totaled 18.7" during January, 209% of its 30-year average. Farther north, Honeydew reported 35.5". An extremely strong jet stream, characteristic of El Nino years, formed early in the winter, blowing across the Pacific to the north of Hawaii (which became very dry, an expected El Nino result), then dipped southward on a southerly track across central Mexico, southern Texas and Florida. Another extension split off and approached the U.S. near the California/Oregon border, and brought a very wet month to the northern half of the state. Then, in early February, the Pacific jet stream strengthened to over 200 mph and moved very close to California. Research aircraft near San Francisco measured some of the highest speeds ever recorded in Earth's atmosphere, about 285 mph near 40,000 feet. On February 2nd and 3rd, just as doubt was beginning to surface in southern California about the reality of El Nino's consequences, the first of a month-long succession of dramatic and impressive storms paid a visit, with high winds, intense rain, heavy mountain snows, and high surf. Embedded in the fast flow, storms followed closely and quickly on each other's heels, for most of the remainder of the month, leaving little time for recovery. Almost no part of the state escaped unaffected. Although storms cannot be individually ascribed to its presence, El Nino certainly played a prominent role in setting the stage as an "enabling factor" for the unfolding sequence of events. Many locations from the San Francisco Bay area southward set February and/or any-month precipitation records, including: UCLA (20.51", wettest month ever), Bakersfield (5.36" wettest Feb), Mojave (6.70", wettest Feb, 615 percent of average), Edwards Air Force Base (5.88", wettest month, 42 years), UC Riverside (9.49", wettest month), Santa Maria 11.59" (wettest month), Los Angeles Civic Center (13.79", wettest Feb), Oxnard 17.80" (wettest month), Ventura Downtown (18.91", wettest month, 132 years), Santa Barbara (21.74", wettest month, 132 years), Lompoc (12.86", wettest month), San Francisco (14.88", wettest Feb, 148 years of records, 508 % of average, old record 12.52" in 1878), and Lake Lagunitas (second to 1891, record starts 1879). Monthly totals reached 36.37" at Cazadero in Sonoma County, with automated mountain gages north of Los Angeles reporting February totals up to 43 inches (likely to be slightly underestimates). In Santa Clara County, Ben Lomond recorded 19.7" in the first 8 days of the month, and by February 20, many locations had already set monthly records. Major episodes included the 3rd-6th, 8th-11th, 17th-19th, and 23rd-24th. North of about Hopland on the Russian River, the constant rains of January and February were spread out well enough that no serious flooding ensued. Eureka reported 13.95", (295%, its third wettest February), with February totals in Crescent City of 19.85" (238%), Orleans 15.26" (223%), and Hayfork 15.36" (312%). The Eight-Station Index for February totaled 20.9" (284%), and the total from Oct 1 through Mar 2 stood at 57.2" (163% for the season-to-date, and 115% of the long-term average for the entire year). The rains were not only heavy but persistent. Eureka recorded 26 days with measureable rain in January, and another 26 days in February. San Francisco counted 24 in January and 22 in February. Blue Canyon had 21 and then 25, with 12 and 10 days respectively exceeding one inch. The lack of any significant letup in rains allowed almost no days for drying. Each period of heavy rain sent more earth sliding to lower elevations at a number of locations in the central and south part of the state. Wet soils above and wave action below eroded oceanfront property the length of the state, with many homes endangered and some lost. Heavy snows brought the snowpack from near (and even below) average in late January to well above in late February, with snowpack as percent of average for the date in the Tahoe / Carson / Walker area increasing from 82-108% of average at month start to 140-152% at month end for February. Overall on March 1 in the Sierra Nevada, snowpack stood at 185 percent of average (north) to 140 percent (central) to 165 percent (south), for a statewide average of 165 percent. Alpine Meadows Ski Area (Tahoe Basin) recorded its snowiest February with 186", just 2 inches shy of the snowiest month on record, and a seasonal accumulation of 396" (annual average is 350"). By late in the month, Mount Shasta Ski Area reported over 200" of snow on the ground. The vigorous storms caused high winds throughout the month up and down the state. On the 2nd gusts to 92 and 100 mph were measured at two oil platforms near Santa Barbara, to 86 at Lompoc and 90 at Hearst Castle, and to 81 in southern Oregon at Cape Blanco. Again on the 7th, winds reached 81 at Cape Blanco, to 62 near Ashland OR, 65 at The Presidio, and to 125 mph at Mt Diablo at 11:20 am on the 7th. Gusts reached 74 north of Weed and 83 at Cape Blanco on the 10th, to 79 there on the 18th, and to 98 numerous times, on the 20th. Sierra winds were relatively quiet all month, reaching 100 mph only once all month on the crest in the Tahoe area. The combination of high winds, heavy surf, intense rains, eroding beaches, sliding earth, washed out roads and bridges, swift current, hail, lightning, and even tornadoes led to a great many inconveniences, considerable property damage, many injuries, and a number of deaths. It should be emphasized that El Nino driven storms do not in general have the "pineapple" connection to the tropics that characterized the New Years Flood of 1997. Although such moisture taps to tropical latitudes sometimes did develop to some degree, the jet stream in February sped straight across the Pacific, seemingly directly from the Nagano Olympics, blowing more than twice as strong as usual from the central Pacific north of Hawaii toward central and southern California. This promotes considerable mid-latitude evaporation over the cool open ocean. El Nino storms tend to be colder storms, with average or somewhat lower than usual snow levels, and access to colder air from south of the Aleutians. For this reason, the El Nino floods that occur in California are generally at lower elevations and nearer the coast, with intense rains in cool unstable air, rather than the large scale warm, wet, tropically influenced rain-on-snow events with high freezing levels that produce the largest floods on the largest mountain-fed rivers. On the main Sierra rivers, none of the historical top-ranked flood flows have occurred in El Nino years.
|
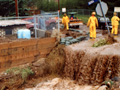
Sleepy Valley
Sleepy Valley
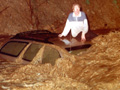
Placerita Creek
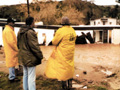
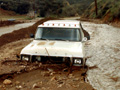
Canyon Country
Canyon Country
|

The site owner makes no assertions as to ownership of any original copyrights to digitized images. However, these images are intended for Personal or Research use only. Any other kind of use, including but not limited to commercial or scholarly publication in any medium or format, public exhibition, or use online or in a web site, may be subject to additional restrictions including but not limited to the copyrights held by parties other than the site owner. USERS ARE SOLELY RESPONSIBLE for determining the existence of such rights and for obtaining any permissions and/or paying associated fees necessary for the proposed use.
